publications
publications by categories in reversed chronological order.
2025
-
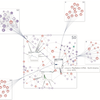
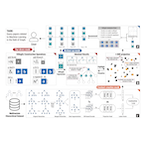 HiRegEx: Interactive Visual Query and Exploration of Multivariate Hierarchical DataGuozheng Li, Haotian Mi, Chi Harold Liu, and 2 more authorsIEEE Transactions on Visualization and Computer Graphics, 2025
When using exploratory visual analysis to examine multivariate hierarchical data, users often need to query data to narrow down the scope of analysis. However, formulating effective query expressions remains a challenge for multivariate hierarchical data, particularly when datasets become very large. To address this issue, we develop a declarative grammar, HiRegEx (Hierarchical data Regular Expression), for querying and exploring multivariate hierarchical data. Rooted in the extended multi-level task topology framework for tree visualizations (e-MLTT), HiRegEx delineates three query targets (node, path, and subtree) and two aspects for querying these targets (features and positions), and uses operators developed based on classical regular expressions for query construction. Based on the HiRegEx grammar, we develop an exploratory framework for querying and exploring multivariate hierarchical data and integrate it into the TreeQueryER prototype system. The exploratory framework includes three major components: top-down pattern specification, bottom-up data-driven inquiry, and context-creation data overview. We validate the expressiveness of HiRegEx with the tasks from the e-MLTT framework and showcase the utility and effectiveness of TreeQueryER system through a case study involving expert users in the analysis of a citation tree dataset.

2024
-
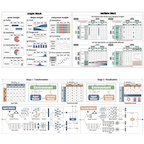 InsigHTable: Insight-driven Hierarchical Table Visualization with Reinforcement LearningGuozheng Li, Peng He, Xinyu Wang, and 5 more authorsIEEE Transactions on Visualization and Computer Graphics, 2024
Embedding visual representations within original hierarchical tables can mitigate additional cognitive load stemming from the division of users’ attention. The created hierarchical table visualizations can help users understand and explore complex data with multi-level attributes. However, because of many options available for transforming hierarchical tables and selecting subsets for embedding, the design space of hierarchical table visualizations becomes vast, and the construction process turns out to be tedious, hindering users from constructing hierarchical table visualizations with many data insights efficiently. We propose InsigHTable, a mixed-initiative and insight-driven hierarchical table transformation and visualization system. We first define data insights within hierarchical tables, which consider the hierarchical structure in the table headers. Since hierarchical table visualization construction is a sequential decision-making process, InsigHTable integrates a deep reinforcement learning framework incorporating an auxiliary rewards mechanism. This mechanism addresses the challenge of sparse rewards in constructing hierarchical table visualizations. Within the deep reinforcement learning framework, the agent continuously optimizes its decision-making process to create hierarchical table visualizations to uncover more insights by collaborating with analysts. We demonstrate the usability and effectiveness of InsigHTable through two case studies and sets of experiments. The results validate the effectiveness of the deep reinforcement learning framework and show that InsigHTable can facilitate users to construct hierarchical table visualizations and understand underlying data insights.
-
 BiaSeer: A Visual Analytics System for Identifying and Understanding Media BiasGuozheng Li, Shiyu Han, Jihe Wu, and 2 more authorsIn Proc. ACM Hum.-Comput. Interact.(CSCW), 2024
Media bias refers to bias in news reporting and coverage that exists pervasively. By identifying media bias, social scientists can understand the different perspectives held by media outlets in news reporting. Existing studies only focus on the analysis of media bias of isolated incidents, but neglect their sustained characteristics. Thus, they cannot provide a comprehensive understanding of specific news topics. We develop BiaSeer, a visual analytics system for identifying and understanding sustained bias of media outlets. BiaSeer employs an overview-to-detail approach for interactive identification of media bias. The overview assists users in determining the analysis scope of media outlets. In addition, it visualizes the variances in coverage patterns between selected media outlets using a matrix visualization to facilitate the identification of biased news articles. BiaSeer visualizes the sustained bias in the context of the events evolution. It first summarizes news articles into events based on a keyword co-occurrence graph and then connects events into a narrative structure using a path-aware story tree construction method. In addition, BiaSeer integrates a sustained bias computation algorithm and enables analysts to compare the narrative structures of different media outlets using the juxtaposition-based visualization approach. We conducted a user experiment to validate the effectiveness of BiaSeer in helping social scientists understand news topics and the usability of visualization designs. To examine the effectiveness of BiaSeer, we conducted a case study with social scientists on the topics of the Russia-Ukraine conflict. The results demonstrate the utility and usability of BiaSeer in efficiently analyzing media bias and attaining a well-rounded understanding of news topics.
-
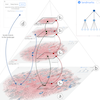
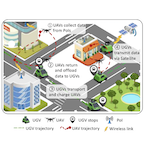 Energy-Efficient Ground-Air-Space Vehicular Crowdsensing by Hierarchical Multi-Agent Deep Reinforcement Learning With Diffusion ModelsYinuo Zhao, Chi Harold Liu, Tianjiao Yi, and 2 more authorsIEEE Journal on Selected Areas in Communications, 2024
 -
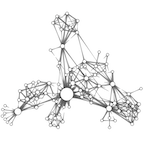
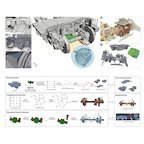 HiNaviMec: Hierarchical Navigation of 3D Mechanical Models in Virtual EnvironmentsYu Zhou, Guozheng Li, Ding Ding, and 4 more authorsJournal of Visualization, 2024
As remote maintenance becomes increasingly prevalent across various industries, the ability to remotely inspect equipment and guide on-site operations has emerged as a crucial aspect. Remote maintenance relies heavily on 3D models comprising densely packed and interconnected parts, presenting a significant challenge in navigation and comprehension for experts. We introduce HiNaviMec, a novel technique designed to enhance the understanding and navigation of complex 3D mechanical models in a virtual environment. HiNaviMec employs a connection detection algorithm for 3D models to establish connections between mechanical parts and generate the mechanical structure graph, and further utilize a weighted graph partitioning algorithm to realize the division of the overall mechanical structure. For each mechanical part, we determine the relational distance and disassembly direction based on the mechanical structure graph. Furthermore, HiNaviMec generates a hierarchical structure to facilitate the understanding of mechanical structure. The usability study on HiNaviMec demonstrates that HiNaviMec effectively aids users in comprehending the internal structure of machinery and assists experts in grasping intricate relationships between components.


2023
-
 CoInsight: Visual Storytelling for Hierarchical Tables with Connected InsightsGuozheng Li, Runfei Li, Yunshan Feng, and 4 more authorsIEEE Transactions on Visualization and Computer Graphics, 2023
 -
 Sticky Links: Encoding Quantitative Data of Graph EdgesMin Lu, Xiangfang Zeng, Joel Lanir, and 4 more authorsIEEE Transactions on Visualization and Computer Graphics, 2023
 -
 HiTailor: Interactive Transformation and Visualization for Hierarchical Tabular DataGuozheng Li, Runfei Li, Zicheng Wang, and 3 more authorsIEEE Transactions on Visualization and Computer Graphics, 2023
Tabular visualization techniques integrate visual representations with tabular data to avoid additional cognitive load caused by splitting users’ attention. However, most of the existing studies focus on simple flat tables instead of hierarchical tables, whose complex structure limits the expressiveness of visualization results and affects users’ efficiency in visualization construction. We present HiTailor, a technique for presenting and exploring hierarchical tables. HiTailor constructs an abstract model, which defines row/column headings as biclustering and hierarchical structures. Based on our abstract model, we identify three pairs of operators, Swap/Transpose, ToStacked/ToLinear, Fold/Unfold, for transformations of hierarchical tables to support users’ comprehensive explorations. After transformation, users can specify a cell or block of interest in hierarchical tables as a TableUnit for visualization, and HiTailor recommends other related TableUnits according to the abstract model using different mechanisms. We demonstrate the usability of the HiTailor system through a comparative study and a case study with domain experts, showing that HiTailor can present and explore hierarchical tables from different viewpoints. HiTailor is available at https://github.com/bitvis2021/HiTailor.
-
 LitVis: a visual analytics approach for managing and exploring literatureMin Tian, Guozheng Li, and Xiaoru YuanJournal of Visualization, 2023
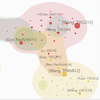
Reading literature is essential to research. However, the explosive growth, the multidimensional attributes, and the complex relationships pose a tremendous challenge for researchers to understand and analyze literature efficiently. We propose LitVis, a visual analysis approach to help users manage and explore literature based on its metadata. LitVis allows users to select literature collection of interest and analyze them from their attributes, text, and citation networks. From the perspective of attribute values, LitVis supports users in understanding the distribution of literature and filtering individuals of interest. From the perspective of the text, LitVis uses the Latent Dirichlet Allocation model to extract topics from the literature and allows users to adjust the topic extraction results interactively. From the citation network perspective, LitVis enables users to analyze citation relationships within and between topics to help them understand research development. One use case and carefully designed interviews with domain experts validate the effectiveness of LitVis in the management and analysis of the literature. The results show that LitVis help users comprehensively identify the literature collection of interest and efficiently analyze the evolution of research topics.
-
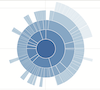
 GoTreeScape: Navigate and Explore the Tree Visualization Design SpaceGuozheng Li, and Xiaoru YuanIEEE Transactions on Visualization and Computer Graphics, 2023
Declarative grammar has becoming an increasingly significant technique for understanding visualization design space. We propose GoTreeScape system to facilitate the navigation and exploration of the vast design space implied by GoTree, a declarative grammar of tree visualizations. To provide users with the design space overview, GoTreeScape utilizes an Encoder-Decoder architecture to project tree visualizations into a 2D landscape, taking into account the relationships between different design features. Furthermore, GoTreeScape includes an exploratory framework, enabling top-down, bottom-up, and hybrid modes to support the inherently undirected nature of exploratory search. We demonstrate that GoTreeScape can expand the diversity of user-designed tree visualizations through two case studies.
-
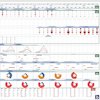
 TokenVis: Visual Analytics for Evolutionary Patterns of Ethereum ERC-20 Smart ContractGuozheng Li, Cong Zhao, Chi Harold Liu, and 2 more authorsChinese Journal of Electronics, 2023
Blockchain techniques have received extensive attention in recent years. The cryptocurrency market based on block-chain techniques is complex and unstable, vulnerable to political, economic and social factors. Existing studies focus on native cryptocurrencies, such as Bitcoin and Ethereum. However, a large number of ERC-20 tokens in the cryptocurrency market exist. ERC-20 tokens have a great market capitalization, attracting many investors’ attention. This paper proposes TokenVis, a visual analytics system to help investors understand the evolutionary patterns of different ERC-20 standard tokens and provide explanations. The TokenVis prototype system integrates a visual analytics framework with different time granularities. We propose SegRank visualization for presenting evolutionary patterns of multiple time series and a time-based COBYLA optimization algorithm to show the relationships between evolutionary patterns and news to provide explanations. We present two case studies involving the evolutionary patterns of different tokens to demonstrate the effectiveness and usability of the TokenVis prototype system.
-
 HiMacMic: Hierarchical Multi-Agent Deep Reinforcement Learning with Dynamic Asynchronous Macro StrategyHancheng Zhang, Guozheng Li, Chi Harold Liu, and 2 more authorsIn Proc. Conf. on Knowledge Discovery and Data Mining (KDD), 2023
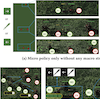
Multi-agent deep reinforcement learning (MADRL) has been widely used in many scenarios such as robotics and game AI. However, existing methods mainly focus on the optimization of agents’ micro policies without considering the macro strategy. As a result, they cannot perform well in complex or sparse reward scenarios like the StarCraft Multi-Agent Challenge (SMAC) and Google Research Football (GRF). To this end, we propose a hierarchical MADRL framework called “HiMacMic" with dynamic asynchronous macro strategy. Spatially, HiMacMic determines a critical position by using a positional heat map. Temporally, the macro strategy dynamically decides its deadline and updates it asynchronously among agents. We validate HiMacMic in four widely used benchmarks, namely: Overcooked, GRF, SMAC and SMAC-v2 with nine chosen scenarios. Results show that HiMacMic not only converges faster and achieves higher results than ten existing approaches, but also shows its adaptability to different environment settings.
-
 Meta Auxiliary Learning for Top-K RecommendationXiming Li, Chen Ma, Guozheng Li, and 4 more authorsIEEE Transactions on Knowledge and Data Engineering, 2023
Recommender systems are playing a significant role in modern society to alleviate the information/choice overload problem, since Internet users may feel hard to identify the most favorite items or products from millions of candidates. Thanks to the recent successes in computer vision, auxiliary learning has become a powerful means to improve the performance of a target (primary) task. Even though helpful, the auxiliary learning scheme is still less explored in recommendation models. To integrate the auxiliary learning scheme, we propose a novel meta auxiliary learning framework to facilitate the recommendation model training, i.e., user and item latent representations. Specifically, we construct two self-supervised learning tasks, regarding both users and items, as auxiliary tasks to enhance the representation effectiveness of users and items. Then the auxiliary and primary tasks are further modeled as a meta learning paradigm to adaptively control the contribution of auxiliary tasks for improving the primary recommendation task. This is achieved by an implicit gradient method guaranteeing less time complexity comparing with conventional meta learning methods. Via a comparison using four real-world datasets with a number of state-of-the-art methods, we show that the proposed model outperforms the best existing models on the Top-K recommendation by 3% to 23%.
-
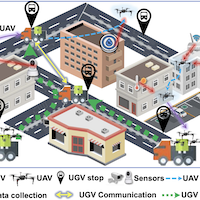 Air-Ground Spatial Crowdsourcing with UAV Carriers by Geometric Graph Convolutional Multi-Agent Deep Reinforcement LearningYu Wang, Jingfei Wu, Xinyuan Hua, and 5 more authorsIn Proc. Conf. on Int. Conf. on Data Engineering (ICDE), 2023
Spatial Crowdsourcing (SC) has been proved as an effective paradigm for data acquisition in urban environments. Apart from using human participant, with the rapid development of unmanned vehicles (UVs) technologies, unmanned aerial or ground vehicles (UAVs, UGVs) are equipped with various high- precision sensors, enabling them to become new types of data collectors. However, UGVs’ operational range is constrained by the road network, and UAVs are limited by power supply, it is thus natural to use UGVs and UAVs together as a coalition, and more precisely, UGVs behave as the UAV carriers for range extensions to achieve complicated air-ground SC tasks. In this paper, we propose a novel communication-based multi- agent deep reinforcement learning method called “GARL”, which consists of a multi-center attention-based graph convolutional network (GCN) to accurately extract UGV specific features from UGV stop network called “MC-GCN”, and a novel GNN- based communication mechanism called “E-Comm” to make the cooperation among UGVs adaptive to constant changing of geometric shapes formed by UGVs. Extensive simulation results on two campuses of KAIST and UCLA campuses show that GARL consistently outperforms eight other baselines in terms of overall efficiency.


2021
-
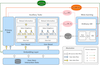
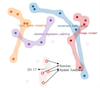
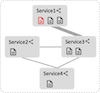 Fast Outage Analysis of Large-scale Production Clouds with Service Correlation MiningYaohui Wang, Guozheng Li, Zijian Wang, and 13 more authorsIn Proc. IEEE/ACM Int. Conf. Software Engineering (ICSE), 2021
Cloud-based services are surging into popularity in recent years. However, outages, i.e., severe incidents that always impact multiple services, can dramatically affect user experience and incur severe economic losses. Locating the root- cause service, i.e., the service that contains the root cause of the outage, is a crucial step to mitigate the impact of the outage. In current industrial practice, this is generally performed in a bootstrap manner and largely depends on human efforts: the service that directly causes the outage is identified first, and the suspected root cause is traced back manually from service to service during diagnosis until the actual root cause is found. Unfortunately, production cloud systems typically contain a large number of interdependent services. Such a manual root cause analysis is often time-consuming and labor-intensive. In this work, we propose COT, the first outage triage approach that considers the global view of service correlations. COT mines the correlations among services from outage diagnosis data. After learning from historical outages, COT can infer the root cause of emerging ones accurately. We implement COT and evaluate it on a real-world dataset containing one year of data collected from Microsoft Azure, one of the representative cloud computing platforms in the world. Our experimental results show that COT can reach a triage accuracy of 82.1%∼83.5%, which outperforms the state-of-the-art triage approach by 28.0%∼29.7%.

2020
-
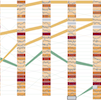
 BarcodeTree: Scalable Comparison of Multiple HierarchiesGuozheng Li, Yu Zhang, Yu Dong, and 5 more authorsIEEE Transactions on Visualization and Computer Graphics, 2020
We propose BarcodeTree (BCT), a novel visualization technique for comparing topological structures and node attribute values of multiple trees. BCT can provide an overview of one hundred shallow and stable trees simultaneously, without aggregating individual nodes. Each BCT is shown within a single row using a style similar to a barcode, allowing trees to be stacked vertically with matching nodes aligned horizontally to ease comparison and maintain space efficiency. We design several visual cues and interactive techniques to help users understand the topological structure and compare trees. In an experiment comparing two variants of BCT with icicle plots, the results suggest that BCTs make it easier to visually compare trees by reducing the vertical distance between different trees. We also present two case studies involving a dataset of hundreds of trees to demonstrate BCT’s utility.
-
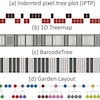
 GoTree: A Grammar of Tree VisualizationsGuozheng Li, Min Tian, Qinmei Xu, and 2 more authorsIn Proc. ACM Conf. Human Factors in Computing Systems (CHI), 2020
We present GoTree, a declarative grammar allowing users to instantiate tree visualizations by specifying three aspects: vi- sual elements, layout, and coordinate system. Within the set of all possible tree visualization techniques, we identify a subset of techniques that are both “unit-decomposable” and “axis-decomposable” (terms we define). For tree visualiza- tions within this subset, GoTree gives the user flexible and fine-grained control over the parameters of the techniques, supporting both explicit and implicit tree visualizations. We developed Tree Illustrator, an interactive authoring tool based on GoTree grammar. Tree Illustrator allows users to create a considerable number of tree visualizations, including not only existing techniques but also undiscovered and hybrid visualizations. We demonstrate the expressiveness and generative power of GoTree with a gallery of examples and conduct a qualitative study to validate the usability of Tree Illustrator.
-
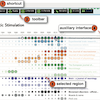
 Interactive Assigning of Conference Sessions with Visualization and Topic ModelingYun Han, Zhenhuang Wang, Siming Chen, and 3 more authorsIn Proc. IEEE Pacific Visualization Symposium (PacificVis, Notes), 2020
Creating thematic sessions based on accepted papers is important to the success of a conference. Facing a large number of papers from multiple topics, conference organizers need to identify the topics of papers and group them into sessions by considering the constraints on session numbers and paper numbers in individual sessions. In this paper, we present a system using visualization and topic modeling to help the construction of conference sessions. The system provides multiple automatically generated session schemes and allows users to create, evaluate, and manipulate paper sessions with given constraints. A case study based on our system on the VAST papers shows that our method can help users successfully construct coherent conference sessions. In addition to conference session management, our method can be extended to other tasks, such as event and class schedule.
-
 Tree Illustrator: Interactive Construction of Tree VisualizationsGuozheng Li, Min Tian, Qinmei Xu, and 2 more authorsIn Extended Abstacts of ACM Conf. Human Factors in Computing Systems, 2020
Creating thematic sessions based on accepted papers is important to the success of a conference. Facing a large number of papers from multiple topics, conference organizers need to identify the topics of papers and group them into sessions by considering the constraints on session numbers and paper numbers in individual sessions. In this paper, we present a system using visualization and topic modeling to help the construction of conference sessions. The system provides multiple automatically generated session schemes and allows users to create, evaluate, and manipulate paper sessions with given constraints. A case study based on our system on the VAST papers shows that our method can help users successfully construct coherent conference sessions. In addition to conference session management, our method can be extended to other tasks, such as event and class schedule.


2017
-
 Interaction+: Interaction enhancement for web-based visualizationsMin Lu, Jie Liang, Yu Zhang, and 4 more authorsIn Proc. IEEE Pacific Visualization Symposium (PacificVis), 2017
In this work, we present Interaction+, a tool that enhances the in- teractive capability of existing web-based visualizations. Different from the toolkits for authoring interactions during the visualization construction, Interaction+ takes existing visualizations as input, analyzes the visual objects, and provides users with a suite of interac- tions to facilitate the visual exploration, including selection, aggregation, arrangement, comparison, filtering, and annotation. Without accessing the underlying data or process how the visualization is constructed, Interaction+ is application-independent and can be employed in various visualizations on the web. We demonstrate its usage in two scenarios and evaluate its effectiveness with a qualitative user study.
